As a tutor, you likely do not need convincing that the need for adult literacy services is real. However, you may be asked questions by those you know. You may also be curious about the specifics here in Arkansas. If you haven’t watched the video on our YouTube Channel, that is a great place to start, but we are going to get into detail here!
For starters, it is important to understand the different adult learning services in Arkansas. There are two major programs that serve adult learners that either need basic skills or lack a diploma. One is the General Education Diploma (GED) program through the Arkansas Adult Learning Resources Center. Another name for this is High School Equivalency (HSE). This is an excellent program for adults who did not get their high school diploma to do so. You can learn more about this program here.
However, many adults lack the reading, writing, math, or English skills to begin this program. They also may lack the confidence in these skills or want to brush up. Further, there are many adults with a diploma that do not have the skills their job requires. That is where local literacy programs step in. Formally known as Community Based Literacy Organizations, these programs work together through the Adult Learning Alliance of Arkansas to reach the literacy needs in our state.
For every program, that looks a little different. Most offer basic literacy skills, English as a second language, health literacy, computer literacy, and more. Some even go farther to focus on their community with food pantries, youth literacy programs, and custom designed offerings that are in high demand in their area.
While there is plenty of room for improvement in the area of adult literacy research, one reliable study is the PIAAC. The PIAAC is a long term study that assessed the literacy and numeracy skills of adults around the world and produced data down to the county level. This data is extremely valuable to local programs in identifying needs and pursuing funding. This study will be repeated in 2023 giving us ongoing comparisons. You can learn more at the PIAAC Skills Map, but just for starters, use this link to explore the counties in Arkansas.
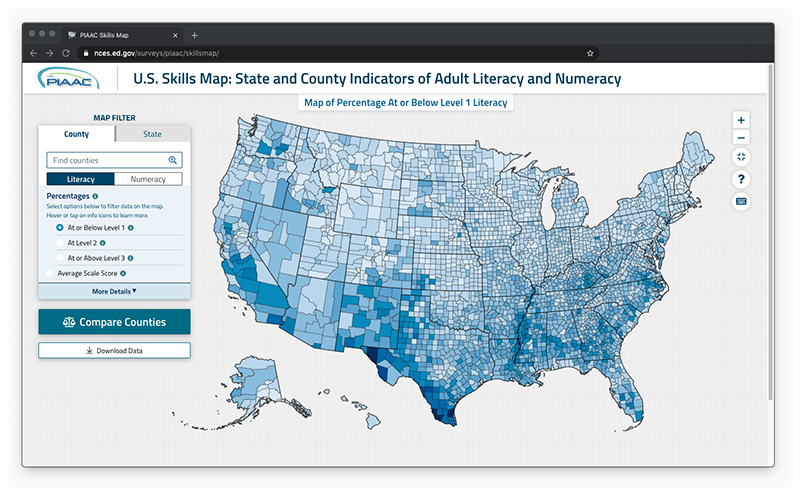
Below is a chart of the percent of adults in each county at or below level 1 literacy and numeracy. According to the PIAAC those at level 1 in literacy, “Most of the tasks at this level require the respondent to read relatively short continuous, noncontinuous, or mixed texts in digital or print format to locate a single piece of information that is identical to or synonymous with the information given in the question or directive. Some tasks, such as those involving noncontinuous texts, may require the respondent to enter personal information into a document. Little, if any, competing information is present. Some tasks may require simply cycling through more than one piece of information. The respondent is expected to have knowledge and skill in recognizing basic vocabulary, determining the meaning of sentences, and reading paragraphs of text.” Those are skills commonly used at about a 3rd grade reading level.
For numeracy, PIAAC describes level 1 as, “Tasks at this level require the respondent to carry out basic mathematical processes in common, concrete contexts where the mathematical content is explicit with little text and minimal distractors. Tasks usually require one-step or simple processes involving counting, sorting, performing basic arithmetic operations, understanding simple percentages such as “50 percent,” or locating and identifying elements of simple or common graphical or spatial representations.” These skills are generally used by 3rd graders.
| County | Percent Below Level 1 Literacy | Percent Below Level Numeracy |
|---|---|---|
| Arkansas | 28% | 42% |
| Ashley | 28% | 43% |
| Baxter | 19% | 28% |
| Boone | 20% | 30% |
| Bradley | 32% | 50% |
| Calhoun | 26% | 42% |
| Carroll County | 22% | 33% |
| Chicot County | 36% | 57% |
| Clark County | 23% | 37% |
| Clay County | 27% | 41% |
| Cleburne County | 21% | 33% |
| Cleveland County | 22% | 35% |
| Columbia County | 28% | 45% |
| Conway County | 24% | 37% |
| Craighead County | 20% | 32% |
| Crawford County | 21% | 33% |
| Crittenden County | 32% | 50% |
| Cross County | 29% | 44% |
| Dallas County | 29% | 45% |
| Desha County | 38% | 58% |
| Drew County | 28% | 44% |
| Faulkner County | 17% | 28% |
| Franklin County | 25% | 38% |
| Fulton County | 22% | 35% |
| Garland County | 20% | 31% |
| Grant County | 17% | 29% |
| Greene County | 20% | 32% |
| Hempstead County | 33% | 49% |
| Hot Spring County | 22% | 35% |
| Howard County | 29% | 42% |
| Independence County | 22% | 34% |
| Izard County | 23% | 35% |
| Jackson County | 32% | 48% |
| Jefferson County | 31% | 50% |
| Johnson County | 29% | 42% |
| Lafayette County | 31% | 48% |
| Lawrence County | 22% | 34% |
| Lee County | 44% | 64% |
| Lincoln County | 32% | 50% |
| Little River County | 24% | 38% |
| Logan County | 24% | 37% |
| Lonoke County | 18% | 28% |
| Madison County | 26% | 39% |
| Marion County | 21% | 33% |
| Miller County | 25% | 40% |
| Mississippi County | 30% | 47% |
| Monroe County | 36% | 56% |
| Montgomery County | 26% | 38% |
| Nevada County | 27% | 45% |
| Newton County | 25% | 37% |
| Ouachita County | 29% | 47% |
| Perry County | 23% | 35% |
| Phillips County | 40% | 60% |
| Pike County | 23% | 35% |
| Poinsett County | 27% | 42% |
| Polk County | 23% | 37% |
| Pope County | 23% | 35% |
| Prairie County | 24% | 38% |
| Pulaski County | 21% | 34% |
| Randolph County | 23% | 35% |
| Saint Francis County | 37% | 27% |
| Saline County | 15% | 24% |
| Scott County | 28% | 41% |
| Searcy County | 22% | 34% |
| Sebastian County | 26% | 38% |
| Sevier County | 37% | 50% |
| Sharp County | 25% | 38% |
| Stone County | 28% | 40% |
| Union County | 27% | 42% |
| Van Buren County | 22% | 35% |
| Washington County | 23% | 33% |
| White County | 22% | 34% |
| Woodruff County | 33% | 50% |
| Yell County | 30% | 43% |